Go  | New  | Find  | Notify  | Tools  | Reply  |  |
| Has Achieved Nirvana |
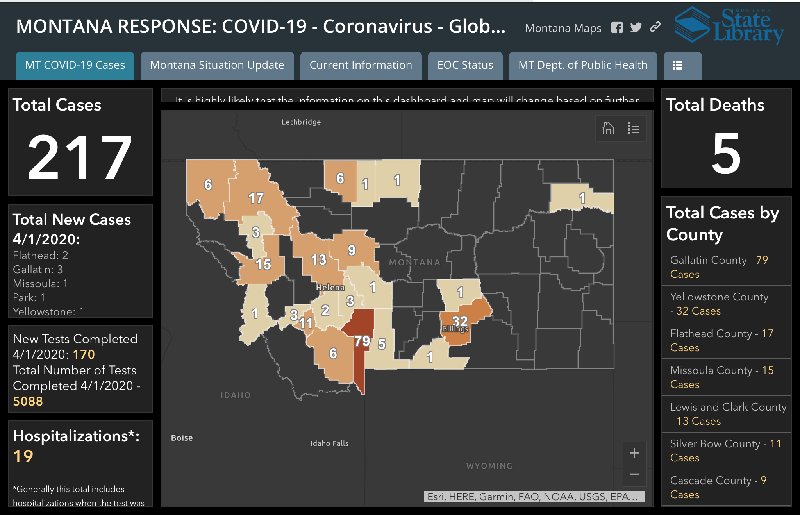
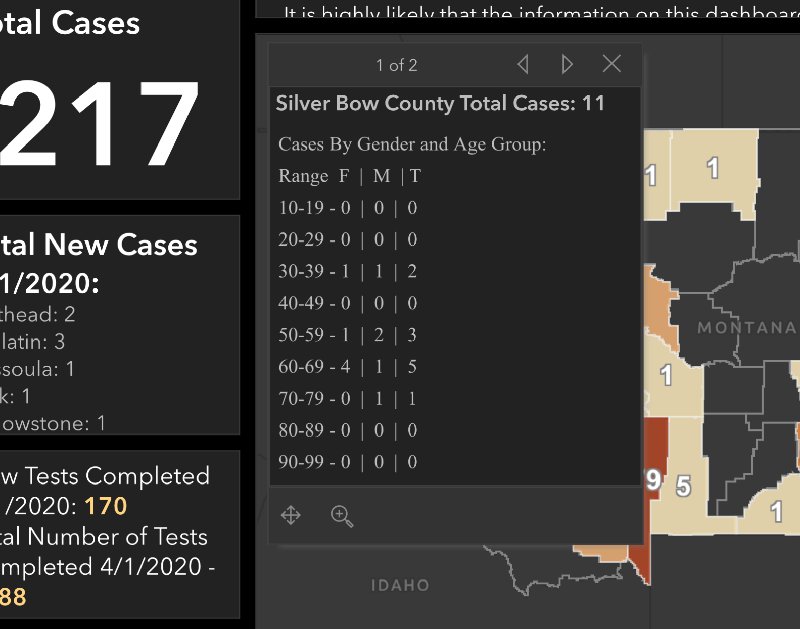
Are there maps like this for all states? What I like about it is the ability to click on the individual counties and see the demographics broken down. (There are A lot of younger folks in Gallatin county that have this - I don’t know the reason for that, seems the case for Yellowstone too - maybe the universities there? ) I think it updates twice a day - the number has increased since I captured the pictures this morning. I also like that hospitalizations is something they are keeping track of. https://montana.maps.arcgis.co...439491adcc2103421d4b  
| ||
|
| Has Achieved Nirvana |
Not nearly as detailed and I suspect not as up to date. https://dph.illinois.gov/covid19 Looks like a lot of outstanding tests. Apparently the private labs like Quest are inundated and turnaround time is crazy long. A couple of days ago Pritzker ordered all tests to go to state labs so they are processed faster. We have first access to the new Abbott 5/15 minute test and they're setting up more and more drive-in facilities, but each does only like 250 tests a day. State has like 12.5 million people with Cook County accounting for 5 million of that. Add the collar counties in, and that northeast corner is where all the action is.
| |||
|
| Has Achieved Nirvana |
There is something from the city of Chicago. https://www.chicago.gov/city/e...ome/latest-data.html Age range of 18-59 represents 70.4% of cases, and the median age of people testing positive is 48. I think that's skewing much younger than Italy, for instance. About 42.5% of cases are hospitalized, with 18-59 year olds representing 47% of that, and 60+ are 52.7%.
| |||
|
| czarina Has Achieved Nirvana  |
MSU. Also they were going ahead with a big international conference for sophomores, I think it was. I don't know for certain that they went ahead with it, but last I knew they didn't cancel.
| |||
|
| Powered by Social Strata |
| Please Wait. Your request is being processed... |
|